SPN Software’s management team completed a day of work in Tegucigalpa, Honduras, with local labor specialists.


SPN Software’s management team completed a day of work in Tegucigalpa, Honduras, with local labor specialists.




1. Data integration
Data integration is a process of bringing together data from different sources to obtain a unified, more valuable view of it so that companies can make better, faster decisions.
a. Data asset
The term “data assets” refers to sets of data, information, or digital resources that an organization considers valuable and critical to its operations or strategic objectives. These data assets can include a wide variety of data types, such as customer data, financial data, inventory data, transaction records, employee information, and any other type of information that is essential for operations and decision making. of a company or organization.
b. Data engineering
Data engineering is a discipline that bases its approach on designing, building and maintaining data processing systems for the storage and processing of large amounts of both structured and unstructured data.
c. Data Cleaning
Data cleansing, also known as data scrubbing, is the process of identifying and correcting errors, inconsistencies, and problems in data sets. This process is essential to guarantee the quality of the data and the reliability of the information found in a database, information system or data set in general. Data cleansing involves a number of tasks, which may include:
Data cleaning is a critical step in the data management process, as inaccurate or dirty data can lead to erroneous decisions and problems in analysis.
2. Data quality
Data quality refers to the extent to which data is accurate, reliable, consistent, and suitable for its intended purpose in an organization. It is essential to ensure that the data used for decision-making, analysis, operations and other processes is of high quality and accurately reflects reality. Data quality involves several key aspects, including:
Improving data quality is essential for an organization to make informed decisions and obtain accurate results from analysis and processes. Data quality management involves implementing policies, processes and technologies to continuously maintain and improve data quality over time.
a. Data enrichment
Data enrichment is a process by which existing data is added or enhanced with additional, more detailed or relevant information. The primary goal of data enrichment is to improve the quality and usefulness of data, which can help organizations make more informed decisions, better understand their customers, and improve the accuracy of their analyzes and models.
b. Data Protection
Data protection refers to measures and practices designed to ensure the security, privacy and integrity of personal or sensitive information. This is essential to protect the confidential information of individuals and organizations from potential threats and abuse.
Some key aspects of data protection include:
c. Data validation
Data validation is a process that involves verifying the accuracy and integrity of data entered or stored in a system or database. The main goal of data validation is to ensure that the data is consistent, reliable, and meets certain predefined criteria or rules. This process is essential to maintain data quality and prevent errors that could affect operations and decision making.
Here are some common techniques and approaches in data validation:
Data validation is essential to ensure data quality and avoid issues such as incorrect or inconsistent data that can impact the accuracy of reporting, decision making, and the efficiency of business processes.
3. Data governance
Data governance is a set of processes, policies, standards and practices that are implemented in an organization to ensure effective management, quality, security and compliance of data throughout the enterprise. The primary goal of data governance is to establish a robust framework that allows an organization to make the most of its data while minimizing risks and ensuring the integrity and confidentiality of the information.
a. Data catalog
A data catalog is a tool or system that acts as a centralized repository of information about data within an organization. Its primary purpose is to provide an organized and detailed view of available data assets, making them easy to discover, access and manage.
The data catalog plays a crucial role in data management and data governance by providing visibility and control over an organization’s data assets.
b. Data lineage
Data lineage is a concept that refers to tracing and documenting the provenance and changes that a data set has undergone throughout its lifecycle. In other words, data lineage shows the complete history of a data item, from its origin to its current state, including all the transformations and processes it has undergone.
c. Data policy and workflow
Data policies and data workflows are two essential components of data management in an organization. Together, they help define how data is handled, stored, protected, and used consistently and efficiently.
d. Data Policy
A data policy is a set of guidelines, rules and principles that establish how data should be managed and used in an organization. These policies are created to ensure data quality, privacy, security, regulatory compliance, and decision-making based on trusted data.
e. Data Workflow
A data workflow, also known as a data process, describes the sequence of steps and tasks that are followed to move, transform, and use data in an organization. These workflows are essential to ensure that data is processed efficiently and effectively from its source to its final destination. Some key elements of a data workflow include:
Both data policies and data workflows are essential for effective data management in an organization. Policies establish the framework for how data should be treated, while workflows enable the practical implementation of those policies in the daily life of the organization.
4. Data status
“Data state” refers to the current condition of data within an organization or system at a specific time. Describes whether the data is accurate, up-to-date, complete, consistent, and available for its intended use. Data health is a critical indicator of the quality and usefulness of the information an organization uses to make decisions, perform analysis, and conduct operations.
a. Business results
“Business results” refer to the achievements, metrics and data that an organization obtains in the course of its business operations. These business results can vary depending on the industry, type of business, and specific objectives of the organization, but in general, they are used to evaluate the performance and success of the company in financial and operational terms.
b. Data Preparation and Data API
“Data Preparation” and “Data APIs” are two important aspects of managing and effectively using data in an organization. Both concepts are described here:
Data Preparation: Data preparation is the process of cleaning, transforming and organizing data so that it is in a suitable format and usable for analysis, reporting or other applications.
Data API: A data API, or data application programming interface, is a set of rules and protocols that allow computer applications and systems to communicate with each other and share data in a structured way.
c. Data Literacy
“Data literacy” refers to a person’s ability to understand, analyze, and use data effectively. It involves the ability to read, interpret, and communicate data-driven information critically and accurately. In a world where data plays an increasingly important role in decision-making, data literacy has become a critical skill both personally and professionally.
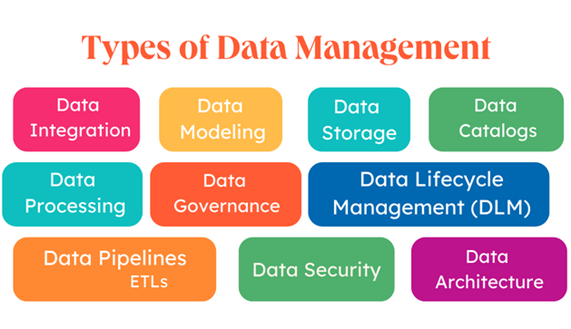
1. Data integration
Organizations often have data scattered across multiple systems. Data integration involves combining data from different sources to obtain a complete and coherent view.
2. Data modeling
Data models are simple diagrams of your systems and the data those systems contain. Data modeling makes it easier for teams to see how data flows through their business systems and processes.
Here are some examples of information that a data model could include:
3. Data storage
Data warehousing is the practice of recording and preserving data for the future, this serves to collect data over time. Once classified neatly, it is possible to access the information you need immediately and easily. In business it is used to make queries that make it easier to find solutions, make decisions and create strategies.
One of its most important functions is to allow businesses to generate and collect contact bases, such as:
4. Data catalog
A data catalog is a detailed inventory of all of an organization’s data assets, designed to help data professionals quickly find the most appropriate data for any business or analytical purpose.
A data catalog uses metadata, data that describes or summarizes data, to create an informative and searchable inventory of all data assets in an organization. These assets may include:
5. Data processing
Data processing refers to the set of actions and transformations performed on data to convert it from its original state into useful, meaningful and actionable information. This involves collecting, organizing, analyzing, manipulating, and presenting data in a way that allows people, systems, or applications to make informed decisions or perform specific tasks.
6. Data governance
Data governance, also known as data governance, is a set of practices, policies, procedures and processes used to manage and control data in an organization. The primary goal of data governance is to ensure that data is reliable, accurate, secure, and available to the right people and systems when needed. Data governance is essential to ensure data quality and to comply with data privacy regulations and standards.
7. Data Lifecycle Management (DLM)
DLM refers to a strategic and practical approach to managing data throughout its entire lifecycle, from its creation to its final deletion or archiving.
The data lifecycle comprises several stages, which can vary by organization and data type, but generally include:
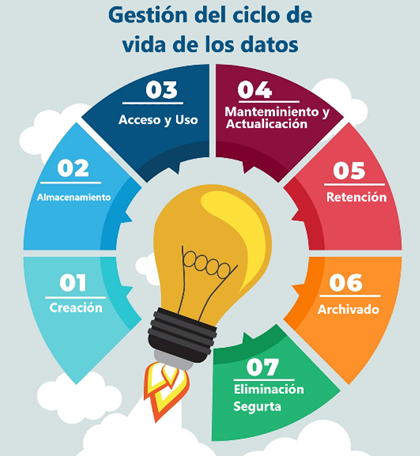
a. Creation: Data is initially created as a result of an activity or process, such as capturing customer information, generating transaction records, collecting sensor data, etc.
b. Storage: Data is stored in storage systems, whether on local servers, in the cloud, or on physical devices.
c. Access and Use: Data is used for various activities, such as analysis, reporting, decision making, real-time applications, among others.
d. Maintenance and Updating: The data may require periodic maintenance to ensure its accuracy and quality. This may include updating records, cleaning duplicate data, and correcting errors.
e. Retention: Data must be retained for a specific period to comply with legal regulations or business purposes. This may vary depending on the type of data and industry.
f. Archiving: After its retention period, data can be archived for long-term preservation, typically in lower-cost, slower-access storage systems.
g. Secure Deletion: When data is no longer needed, it should be securely deleted to protect the privacy and security of the information.
8. Data Pipeline (ETL)
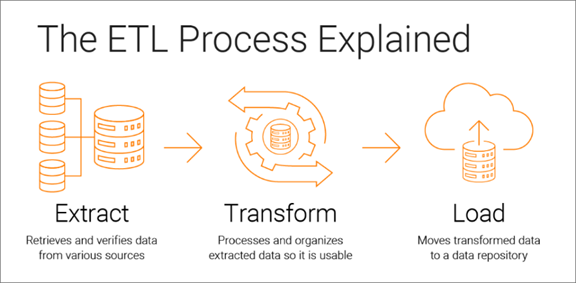
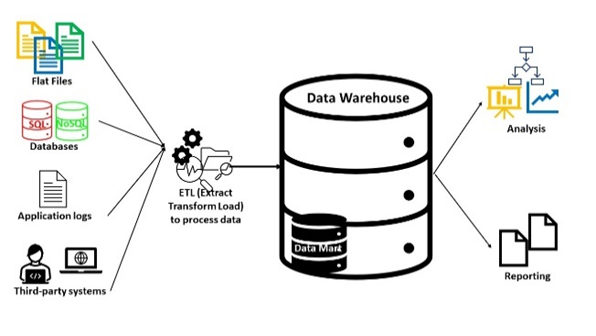
Data Pipeline (also known as data pipeline) is a set of processes and technologies that enable the extraction, transformation, and loading (ETL) of data from multiple data sources to a final destination, such as a database. data, a data warehouse or an analysis system. These pipelines are used to move data from one place to another efficiently and reliably, and are often a critical part of the data infrastructure in organizations.
Here is a description of the three main phases of a Data Pipeline:
9. Data security
Data security, also known as cybersecurity or information security, refers to the practices, measures and technologies designed to protect an organization’s data and information from threats, attacks and unauthorized access. Data security is essential today due to the increasing amount of digital data stored and shared on computer systems and networks.
Aspectos importantes de la seguridad de los datos.

10. Data architecture
Data architecture refers to the structure and design of how an organization stores, organizes, processes and manages its data. It is an essential component of data management in a company or entity, and its main objective is to ensure that data is available, accessible, reliable and meets the business and technological requirements of the organization.
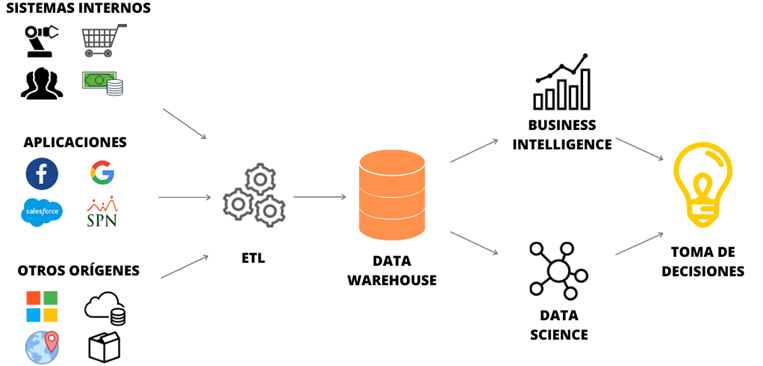
Data governance defines roles, responsibilities, and processes to ensure accountability and ownership of data assets across the enterprise.
Data governance is a system for defining who within an organization has authority and control over data assets and how those data assets can be used. It encompasses the people, processes, and technologies needed to manage and protect data assets.
The Data Governance Institute defines it as “a system of decision rights and responsibilities for information-related processes, executed according to agreed models that describe who can take what actions with what information, and when, under what circumstances, using what methods.”
The Data Management Association (DAMA) International defines it as the “planning, monitoring and control over data management and the use of data and data-related sources.”
Data governance can best be thought of as a function that supports an organization’s overall data management strategy. Such a framework provides your organization with a holistic approach to collecting, managing, protecting, and storing data. To help understand what a framework should cover, DAMA envisions data management as a wheel, with the governance of
Data as the hub from which the following 10 data management knowledge areas radiate:
When establishing a strategy, each of the above facets of data collection, management, archiving, and use should be considered.
The Business Application Research Center (BARC) warns that data governance is a highly complex and ongoing program, not a “big bang initiative,” and risks participants losing trust and interest over time. To counter that, BARC recommends starting with a manageable or application-specific prototype project and then expanding across the enterprise based on lessons learned.
BARC recommends the following steps for implementation:
Data governance is only one part of the overall discipline of data management, although it is important. While data governance is about the roles, responsibilities, and processes for ensuring accountability and ownership of data assets, DAMA defines data management as “an umbrella term describing the processes used to plan, specify, enable, create, acquire, maintain, use, archive, retrieve, control, and purge data.”
While data management has become a common term for the discipline, it is sometimes referred to as data resource management or enterprise information management (EIM). Gartner describes EIM as “an integrative discipline for structuring, describing and governing information assets across organizational and technical boundaries to improve efficiency, promote transparency and enable business insight.”
Most companies already have some form of governance in place for individual applications, business units, or functions, even if the processes and
Responsibilities are informal. As a practice, it is about establishing systematic and formal control over these processes and responsibilities. Doing so can help businesses remain responsive, especially as they grow to a size where it’s no longer efficient for people to perform cross-functional tasks. Several of the overall benefits of data management can only be realized after the company has established systematic data governance. Some of these benefits include:
The goal is to establish the methods, set of responsibilities, and processes for standardizing, integrating, protecting, and storing corporate data. According to BARC, the key objectives of an organization should be:
BARC notes that such programs always span the strategic, tactical and operational levels in companies, and should be treated as continuous, iterative processes.
According to the Data Governance Institute, eight principles are at the core of all successful data governance and management programs:
Data governance strategies must adapt to best fit an organization’s processes, needs, and goals. Still, there are six basic best practices worth following:
For more information on how to get data governance right, see “6 Best Practices for Good Data Governance.”
Good data governance is not an easy task. It requires teamwork, investment and resources, as well as planning and monitoring. Some of the main challenges of a data governance program include:
To learn more about these pitfalls and others, see “7 Data Governance Mistakes to Avoid.”
Data governance is an ongoing program rather than a technology solution, but there are tools with data governance features that can help support your program. The tool that suits your business will depend on your needs, data volume, and budget. According to PeerSpot, some of the most popular solutions include:
Data Governance Solution
Colllibra Governance: Collibra is an enterprise-wide solution that automates many governance and administration tasks. It includes a policy manager, a data help desk, a data dictionary, and a business glossary.
SAS Data Management: Built on the SAS platform, SAS Data Management provides a role-based GUI for managing processes and includes an integrated enterprise glossary, SAS and third-party metadata management, and lineage visualization.
Erwin Data Intelligence (DI) for Data Governance: Erwin DI combines data catalog and data literacy capabilities to provide insight and access to available data assets. It provides guidance on the use of those data assets and ensures that data policies and best practices are followed.
Informatica Axon: Informatica Axon is a collection center and data marketplace for support programs. Key features include a collaborative business glossary, the ability to visualize data lineage, and generate data quality measurements based on business definitions.
SAP Data Hub: SAP Data Hub is a data orchestration solution aimed at helping you discover, refine, enrich, and govern all types, varieties, and volumes of data across your data environment. It helps organizations establish security settings and identity control policies for users, groups, and roles, and streamline best practices and processes for security logging and policy management.
Alathion: A business data catalog that automatically indexes data by source. One of its key capabilities, TrustCheck, provides real-time “guardrails” to workflows. Designed specifically to support self-service analytics, TrustCheck attaches guidelines and rules to data assets.
Varonis Data Governance Suite: Varonis’ solution automates data protection and management tasks by leveraging a scalable metadata framework that allows organizations to manage data access, view audit trails of every file and email event, identify data ownership across different business units, and find and classify sensitive data and documents.
IBM Data Governance: IBM Data Governance leverages machine learning to collect and select data assets. The integrated data catalog helps companies find, select, analyze, prepare, and share data.
Data Governance Certifications
Data governance is one system, but there are some certifications that can help your organization gain an edge, including the following:
For related certifications, see “10 Master Data Management Certifications That Will Pay Off.”
Data governance roles
Every company makes up its data governance differently, but there are some commonalities.
Steering Committee: Governance programs are enterprise-wide, usually beginning with a steering committee composed of senior managers, often C-level individuals or vice presidents responsible for lines of business. Morgan Templar, author of Get Governed: Building World Class Data Governance Programs, says steering committee members’ responsibilities include setting the overall governance strategy with specific outcomes, championing the work of data stewards, and holding the governance organization accountable for timelines and results.
Data owner: Templar says data owners are individuals responsible for ensuring that information within a specific data domain is governed across systems and lines of business. They are generally members of the steering committee, although they may not be voting members. Data subjects are responsible for:
Data Administrator: Data stewards are responsible for the day-to-day management of data. They are subject matter experts (SMEs) who understand and communicate the meaning and use of information, Templar says, and work with other data stewards across the organization as the governing body of the organization.
Most data decisions. Data stewards are responsible for:
The explosion of artificial intelligence is making people rethink what makes us unique. Call it the AI effect.

Artificial intelligence has made impressive leaps in the last year. Algorithms are now doing things, like designing drugs, writing wedding vows, negotiating deals, creating artwork, composing music, that have always been the sole prerogative of humans.
There has been a lot of furious speculation about the economic implications of all this. (AI will make us wildly productive! AI will steal our jobs!) However, the advent of sophisticated AI raises another big question that has received far less attention: How does this change our sense of what it means to be human? ? Faced with ever smarter machines, are we still… well, special?
“Humanity has always seen itself as unique in the universe,” says Benoît Monin, a professor of organizational behavior at Stanford Business School. “When the contrast was with animals, we pointed to our use of language, reason, and logic as defining traits. So what happens when the phone in your pocket is suddenly better than you at these things?”
Monin and Erik SantoroOpen in a new window, then a doctoral candidate in social psychology at Stanford, started talking about this a few years ago, when a program called AlphaGo was beating the world’s best players at the complex strategy game Go. What intrigued them was how people reacted to the news.
“We noticed that when discussing these milestones, people often seemed defensive,” says Santoro, who earned his Ph.D. this spring and will soon begin a postdoc at Columbia University. “The talk would gravitate towards what the AI couldn’t do yet, like we wanted to make sure nothing had really changed.”
And with each new breakthrough, Monin adds, came the refrain: “Oh, that’s not real intelligence, that’s just mimicry and pattern matching,” ignoring the fact that humans also learn by imitation, and we have our own share of heuristics. flaws, biases, and shortcuts that fall far short of objective reasoning.
This suggested that if humans felt threatened by new technologies, it was about more than just the safety of their paychecks. Perhaps people were anxious about something more deeply personal: their sense of identity and their relevance in the grand scheme of things.
There is a well-established model in psychology called social identity theory. The idea is that humans identify with a chosen group and define themselves in contrast to outgroups. It is that deeply ingrained us vs. them instinct that drives so much social conflict.
“We thought, maybe AI is a new benchmark group,” Monin says, “especially since it’s portrayed as having human-like traits.” He and Santoro wondered: If people’s sense of uniqueness is threatened, will they try to distinguish themselves from their new rivals by changing their criteria of what it means to be human—in effect, moving the goal posts?
To find out, Santoro and Monin put together a list of 20 human attributes, 10 of which we currently share with AI. The other 10 were traits that they felt were distinctive to humans.
They polled 200 people on how capable they thought humans and AI were at each trait. Respondents rated humans most capable on all 20 traits, but the gap was small on shared traits and quite large on distinctive ones, as expected.
Now for the main test: The researchers divided about 800 people into two groups. Half read an article titled “The Artificial Intelligence Revolution,” while a control group read an article about the remarkable attributes of trees. Then, going back to the list of 20 human attributes, test subjects were asked to rate “how essential” each one is to being human.
Indeed, people reading about AI rated distinctively human attributes like personality, morality, and relationships as more essential than those who read about trees. In the face of advances in AI, people’s sense of human nature has been reduced to emphasize traits that machines do not have. Monin and Santoro called this the AI Effect.
To rule out other explanations, they performed several more experiments. In one, participants were simply told that the AI was getting better. “Same result,” says Monin. “Every time we mentioned advances in AI, we got this increase in the importance of distinctive human attributes.”
Surprisingly, the participants did not downplay traits shared by humans and AI, as the researchers had predicted they would. “So even if humans aren’t the best at logic anymore, they didn’t say that logic is any less central to human nature,” Santoro notes.
Of course, artificial intelligence isn’t exactly like an invading tribe with foreign manners; after all, we created it to be like us. (Neural networks, for example, are inspired by the architecture of the human brain.) But there’s an irony here: the cognitive abilities and ingenuity that made AI possible are now the realm in which machines are outpacing us. And as the present research findings suggest, that may lead us to place more value on other traits.
It’s also worth noting that those cognitive skills still command high status and salary. Could that change if soft skills like warmth and empathy, the ability to nurture growth in others, are valued more? Will lawyers and quants be paid less, while teachers and carers receive more respect and money?
“That’s certainly one possible implication of our work,” Monin says. “There are a lot of skills that will not only not be taken over by AI, but people will increasingly value. In a world of ubiquitous and capable AI, soft skills will likely be increasingly sought after by employers” .
In the meantime, he says to her, the effect of the AI is likely to be growing. “Since we conducted this research, the real world has surpassed anything we could have imagined. There has been a constant barrage of information about new achievements in AI. So everything we saw in our little version in the lab is probably already happening to a much broader scale in society.
Machine learning (ML) and artificial intelligence (AI) have received a lot of public interest in recent years, and both terms are practically commonplace in IT parlance. Despite their similarities, there are some important differences between ML and AI that are often neglected.
Therefore, we will cover the key differences between ML and AI in this blog so that you can understand how these two technologies vary and how they can be used together.
Let’s get started!
Understanding Machine Learning (ML)
Machine learning (ML) is a subfield of artificial intelligence (AI) that automates the analysis and prediction of data using algorithms and statistical models. It allows systems to recognize patterns and correlations in large amounts of data and can be applied to a variety of applications such as image recognition, natural language processing, and others.
ML is fundamentally about learning from data. It is a continuous method of developing algorithms that can learn from past data and predict future data. In this approach, ML algorithms can continually improve their performance over time by discovering previously unknown or undetectable patterns.
Types of Machine Learning Algorithms
There are commonly 4 types of machine learning algorithms. Let’s get to know each one of them.

1. Supervised learning
Supervised learning includes providing the ML system with labeled data, which helps it understand how unique variables connect to each other. When presented with new data points, the system applies this knowledge to make predictions and decisions.
2. Unsupervised learning
Unlike supervised learning, unsupervised learning does not require labeled data and uses various clustering methods to detect patterns in large amounts of unlabeled data.
3. Reinforcement learning
Reinforcement learning involves training an agent to act in a specific context by rewarding or punishing it for its actions.
4. Transfer learning
Transfer learning includes using knowledge from previous activities to learn new skills efficiently.
Now, for more understanding, let’s explore some machine learning examples.
Machine Learning Examples
Let’s understand machine learning more clearly through real life examples.
1. Image Recognition: Machine learning is applied to photos and videos to recognize objects, people, landmarks, and other visual elements. Google Photos uses ML to understand faces, locations, and other elements in images so they can be conveniently searched and categorized.
2. Natural Language Processing (NLP): NLP allows machines to interpret language as humans do. Automated customer service chatbots, for example, use ML algorithms to reliably answer queries by understanding text and recognizing the purpose behind it.
3. Speech Recognition: ML is used to allow computers to understand speech patterns. This technology is used for voice recognition applications such as Amazon’s Alexa or Apple’s Siri.
4. Recommendation Engines: Machine learning algorithms identify patterns in data and make suggestions based on those patterns. Netflix, for example, applies machine learning algorithms to suggest movies or TV shows to viewers.
5. Self-driving cars: Machine learning is at the heart of self-driving cars. It is used for object detection and navigation, allowing cars to identify and navigate around obstacles in their environment.
Now, we hope you get a clear understanding of machine learning. Now is the perfect time to explore Artificial Intelligence (AI). So, without further ado, let’s dive into the AI.
Understanding artificial intelligence (AI)
Artificial intelligence (AI) is a type of technology that attempts to replicate the capabilities of human intelligence, such as problem solving, decision making, and pattern recognition. In anticipation of changing circumstances and new insights, AI systems are designed to learn, reason, and self-correct.
Algorithms in AI systems use data sets to obtain information, solve problems, and develop decision-making strategies. This information can come from a wide range of sources, including sensors, cameras, and user feedback.
Algorithms in AI systems use data sets to obtain information, solve problems, and develop decision-making strategies. This information can come from a wide range of sources, including sensors, cameras, and user feedback.
AI has been around for several decades and has grown in sophistication over time. It is used in various industries including banking, healthcare, manufacturing, retail, and even entertainment. AI is rapidly transforming the way businesses operate and interact with customers, making it an indispensable tool for many companies.
In the modern world, AI has become more common than ever. Businesses are turning to AI-powered technologies such as facial recognition, natural language processing (NLP), virtual assistants, and autonomous vehicles to automate processes and reduce costs.
Ultimately, AI has the potential to revolutionize many aspects of everyday life by providing people with more efficient and effective solutions. As AI continues to evolve, it promises to be an invaluable tool for companies looking to increase their competitive advantage.
We have many examples of AI associated with our daily lives. Let’s explore some of them:

AI Examples
Some of the real life use cases of Artificial Intelligence are:
1. Video Analytics: Video Analytics is an AI application that analyzes video streams and extracts valuable data from them using computer vision algorithms. It can be used to detect unusual behavior or recognize faces for security purposes.
This technology is widely used in airports and hotel check-ins to recognize passengers and guests respectively.
2. Autonomous Cars: Autonomous cars are becoming more common and are considered an important example of artificial intelligence. They use sensors, cameras, and machine learning algorithms to detect obstacles, plan routes, and change vehicle speed based on external factors.
3. Robotics: Another important implementation of AI is robotics. Robots can use machine learning algorithms to learn how to perform various tasks, such as assembling products or exploring dangerous environments. They can also be designed to react to voice or physical instructions.
They are used in shopping malls to help customers and in factories to help with daily operations. Furthermore, you can also hire AI developers to develop AI-powered robots for your businesses. Apart from these, AI-powered robots are also used in other industries such as the military, healthcare, tourism, and more.
4. Voice Assistants: Artificial intelligence is used by virtual voice assistants like Siri, Alexa, and Google Home to understand natural language commands and respond appropriately. Natural Language Processing (NLP) is used by these voice assistants to understand user commands and respond with pertinent information.
5. Image Recognition: Image recognition is a type of artificial intelligence (AI) application that uses neural networks as a way to recognize objects in an image or video frame. It can be used in real time to identify objects, emotions, and even gestures.
The AI and machine learning examples are quite similar and confusing. Both look similar at first glance, but in reality, they are different.
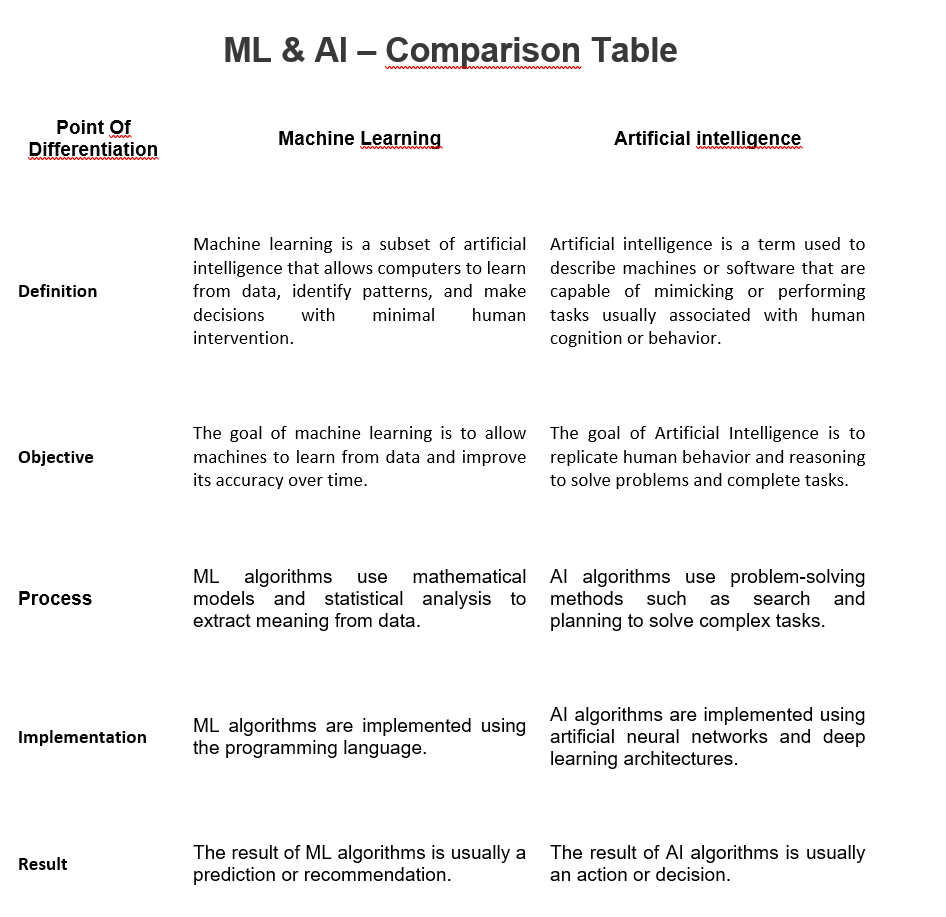
In fact, machine learning is a subset of artificial intelligence. To explain this more clearly, we will differentiate between AI and machine learning.
Machine Learning s Artificial Intelligence: the key differences!
Machine learning (ML) and artificial intelligence (AI) are two related but different concepts. While both can be used to build powerful computing solutions, they have some important differences.
1. Approach:
One of the main differences between ML and AI is their approach. Machine learning focuses on developing systems that can learn from data and make predictions about future outcomes. This requires algorithms that can process large amounts of data, identify patterns, and generate insights from them.
AI, on the other hand, involves creating systems that can think, reason, and make decisions on their own. In this sense, AI systems have the ability to “think” beyond the data they are given and propose solutions that are more creative and efficient than those derived from ML models.
2. Type of problems they solve:
Another difference between ML and AI is the types of problems they solve. ML models are typically used to solve predictive problems, such as predicting stock prices or detecting fraud.
However, AI can be used to solve more complex problems such as natural language processing and computer vision tasks.
3. Computing power consumption:
Finally, ML models tend to require less computing power than AI algorithms. This makes ML models more suitable for applications where power consumption is important, such as mobile devices or IoT devices.
In simple words, machine learning and artificial intelligence are related but different fields. Both AI and ML can be used to create powerful computing solutions, but they have different approaches and types of problems they solve and require different levels of computing power.
Conclusion
Machine learning and artificial intelligence are two different concepts that have different strengths and weaknesses. ML focuses on developing algorithms and models to automate data-driven decisions.
On the other hand, AI emphasizes the development of self-learning machines that can interact with the environment to identify patterns, solve problems, and make decisions.
Both are important to businesses, and it’s important to understand the differences between the two to take advantage of their potential benefits. Therefore, it is the right time to get in touch with an AI application development company, equip your business with AI and machine learning and enjoy the benefits of these technologies.
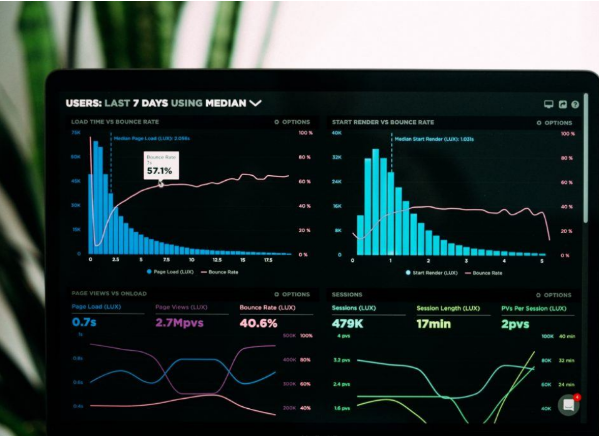
Representing data using graphics such as tables, diagrams, infographics, heat maps, bubble clouds, scatter plots, and mekko charts is called data visualization. These visual displays and information representations help communicate complex data relationships and data-driven insights in a way that makes it easy to understand and inform decisions.
The goal of data visualization is to help identify patterns and trends from large data sets. Data refers to the processing of immersive and interactive visualizations that show new data as it is streamed. There is a huge volume of data available today, and to gain any benefit from that abundance of data, real-time analytics has become extremely necessary for businesses to gain an edge over their competition. Real-time visualizations can be very useful for companies that need to make strategic or on-the-fly decisions.
It is useful for companies that need to deal with risk, both managing it and responding if something goes wrong. And, for those companies that can use these real-time visualizations to take advantage of emerging opportunities before someone else does. Real-time visualizations work best when input-based action needs to be taken immediately by providing context to decision makers.
Business benefits of data visualization:
Information processing: With a constant stream of data being generated in real time, it is impossible to process and make sense of it just by looking at it. Visualization helps make sense of the clutter of numbers and text in a better way. It is also easier to absorb and interpret data when it is presented visually.
Relevant insights: Data visualization provides relevant insights by connecting and showing patterns of how different data sets are connected. This can help easily identify and extract trends and patterns that might not otherwise be visible from the raw data. This is especially important when streaming data is presented and trends can be forecast using real-time visualizations.
In financial trading systems, such real-time data visualizations can show real-time ROI, profit and loss and help companies make immediate decisions.
Business operations: Data visualizations give businesses insight overview of the current relationship between various sections and operations of the business. help in the decision-making process and in the management of critical business metrics. Can Help review and analyze areas for improvement.
Decision making: The pattern becomes clearer with data visualization, facilitating faster decision making. Since there is a synchronization between real-time data and its visualization, companies can make quick decisions that can significantly affect the organization.
Customer Analytics: Real-time data visualization helps analyze customer data to understand business trend. It can reveal information about the understanding and knowledge of the target audience, their preferences and more. Such insights can be helpful in designing strategies that can address customer requirements.
Save time: It is easier to understand, process and make decisions based on graphically represented data instead of going through tons of reports with raw data and generate reports on time. Real-time data visualizations help save time by categorizing and displaying trends and patterns in real time.
Data Interaction: Data visualization helps group and categorize data and encourages employees to spend time on data interaction through data visualization. This leads to better ideas and helps in problem solving. Help design and create actionable business solutions.
Real-time data visualization provides additional context for decision makers who need to respond immediately when faced with risk, and for businesses that need to make quick decisions before an opportunity is missed.
Some of the use cases for real-time data visualizations are:
Conclusion
Data is the key to decision making in any business. Helping the decision-making process by actively rendering real-time data using different real-time rendering and visualization methods can give the business a winning competitive advantage.
This website uses cookies to optimize your browsing experience, improve performance, analyze traffic, and personalize content. You can accept all cookies or manage your preferences at any time.
